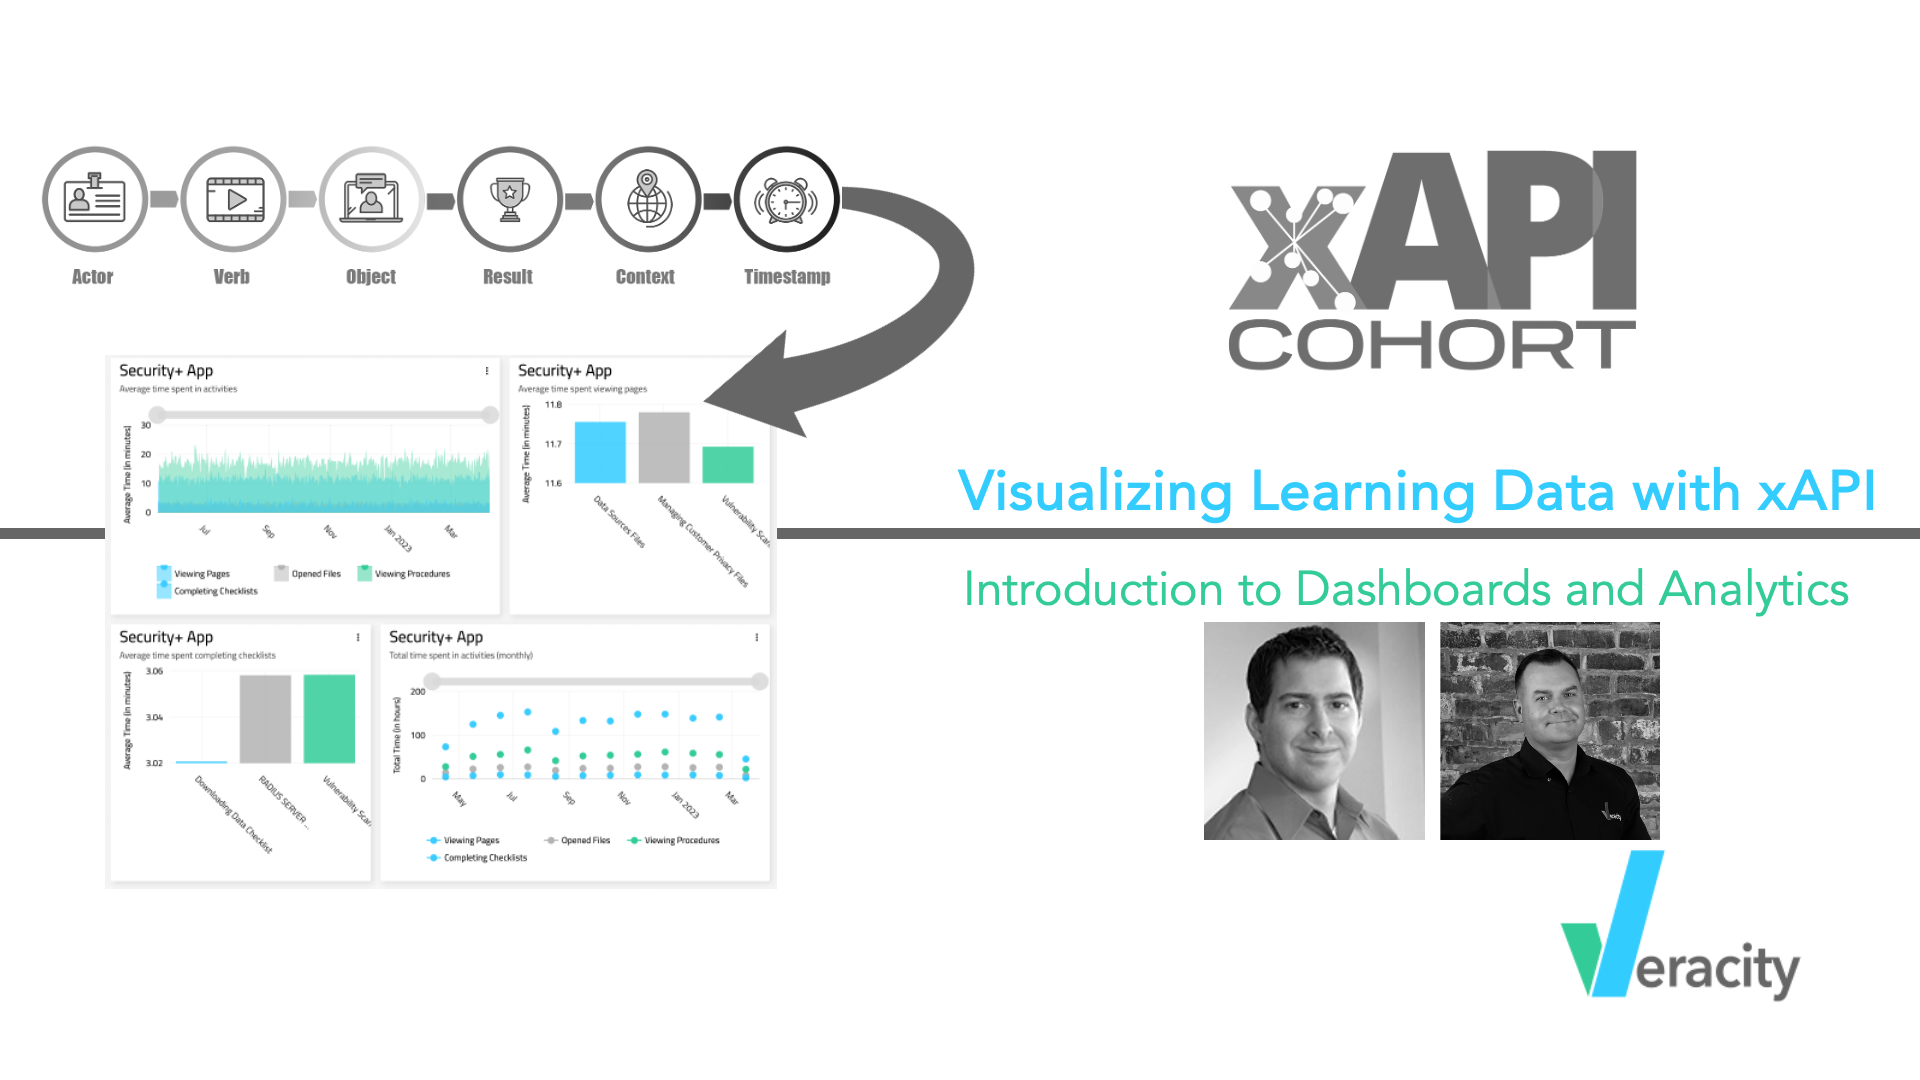
Veracity's Rob Chadwick and Jason Haag presented "Visualizing Learning Data with xAPI: Introduction to Dashboards & Analytics" in the last week of the Learning Guild's Spring 2024 xAPI Cohort.
For those of you that missed the presentation, here’s the link on The Learning Guild's xAPI Cohort youtube channel: https://www.youtube.com/watch?v=8WN4F9gh-is.
Jason covered measurement and evaluation strategy while Rob shared his tips for thinking statistically when visualizing learning data and also provided some live examples. This session highlights the importance of effectively measuring, collecting, and then interpreting learning and performance data. It also provides some useful techniques for crafting insightful dashboards, enabling stakeholders to grasp learning outcomes, discern trends, and make well-informed decisions.