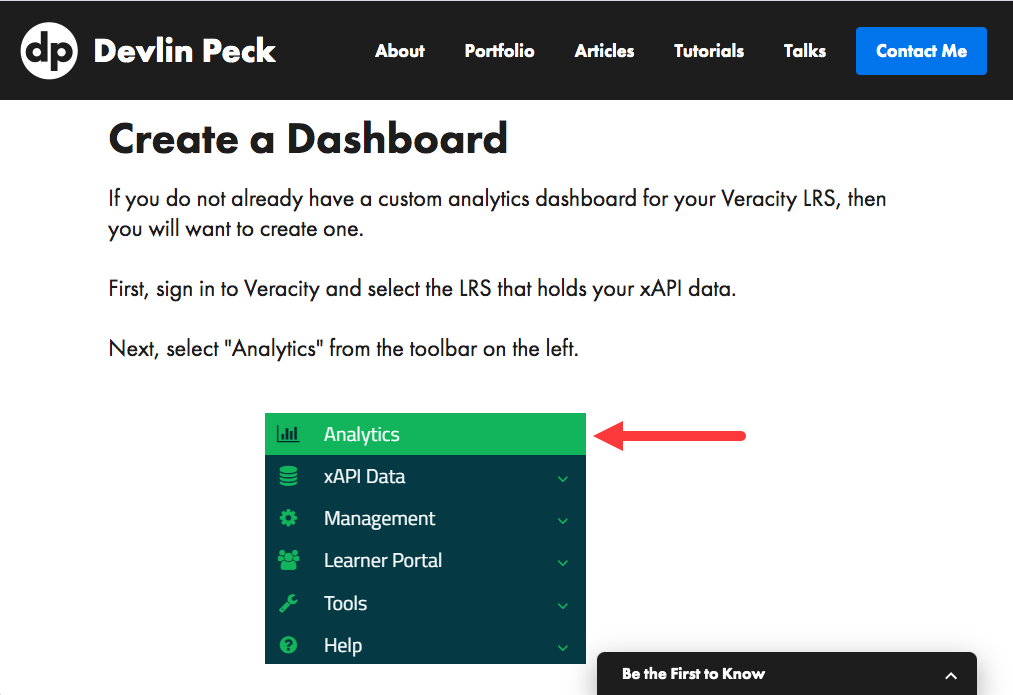
E-learning content developer Devlin Peck recently released two new step-by-step tutorials for using the Veracity Learning LRS on his website. Anyone interested in walking through the tutorials can use the free version of our cloud-hosted SaaS LRS by registering for an account. There's also free download version where you can run the LRS locally on your computer.
The first tutorial from Devlin is on How to Create Pie Charts to Visualize Question Responses. This is a great resource for learning how to create custom dashboards for assessment question responses.
The second tutorial is on Visualize xAPI Duration Data with VQL. This is a great resource for learning some basics about Veracity Query Language (VQL) and for tapping into analytics around how much time people spend in an activity. VQL provides a robust yet simplified language for creating complex queries over xAPI data. Check out some of the prebuilt queries we have available by logging into your LRS and clicking on "VQL Workshop." Note: You must create an LRS first and have some data in your LRS before you can use VQL.
We also want to highlight that Devlin has an excellent Getting Started with xAPI Tutorial Series that's highly recommended if you're just learning how to get up and running with xAPI.
We're excited to see so many developers diving into using the rich features of our LRS. We really did design it with developers in mind! You can find more tutorials on using Veracity Learning LRS at https://lrs.io after creating an account. We also have extensive documentation and video tutorials available on our YouTube Channel.
As usual, please reach out to us any time if we can be of assistance with using the LRS!


